
Capitalism’s Empirical Test: The US Fails, Czech Republic Passes?
Evidence from Household Saving Data Across Ten Countries

Abstract
This essay uses household saving data from the OECD Distributional National Accounts and the BEA/BLS Distribution of Personal Saving to test which countries are delivering the core promise of capitalism: broad accumulation of economic surplus across the income distribution. The United States, commonly regarded as capitalism’s exemplar, shows a saving gradient—the gap between what the top and bottom income groups save—of nearly +100 percentage points, with the bottom 40–60% of households structurally prevented from saving. The Czech Republic, whose egalitarian asset distribution traces to communist-era housing privatization and compressed wage institutions, shows a gradient of +21 percentage points with positive saving at every quintile. The essay argues that this reversal is diagnostic, not paradoxical: capitalism’s outcomes depend substantially on the initial distribution of productive assets and the suppression of economic rent, not on the label attached to the system. Because the mechanisms driving the US pattern—rent extraction, monopsony, and extractive consumer credit—are features of the pre-capitalist institutions capitalism was supposed to replace, the appropriate policy response is therefore not redistribution, the traditional answer, but restorative justice—returning to households and communities the economic surplus that state-backed coercion and rent extraction have transferred upward.
Opening: The Paradox in the Data
Consider two countries.
In the first, the bottom quintile of households spends 165 cents for every dollar of income it earns. The second and third quintiles also spend more than they earn—by 22% and 4% respectively. Only the top two quintiles accumulate capital routinely. This is not a crisis anomaly. It is the stable, structural condition of the household sector, observed in every year from 2004 to 2019, across two recessions and a decade-long expansion.
In the second country, the bottom quintile saves 3% of its income (2.2% on the adjusted basis used in the cross-country table below). The second, third, and fourth quintiles all save between 5% and 9%. The top quintile saves 23%. Every quintile accumulates capital every year.
The first country is the United States. The second is the Czech Republic.
If we define capitalism as an institutional order in which the capacity to accumulate economic surplus is broadly available across the income distribution—not restricted to an elite—then the data pose a direct question: which of these two countries is doing a better job of being capitalist?
The question is not rhetorical. It is a measurement. And the measurement says something important about the gap between the label “capitalist” and the substance the label is supposed to denote.
The Test: What Capitalism Should Produce
In a companion essay, Why Are Capitalists Anti-Capitalist?, I argued that capitalism is best understood as an institutional order characterized by the generalized legal and practical capacity of individuals to accumulate, retain, and deploy economically consequential surplus. The key word is generalized. The goal of this definition is to isolate what was historically novel about capitalism—what distinguished it from prior economic orders. Private property, voluntary exchange, and market coordination are prerequisites of a modern capitalist state, but they do not distinguish capitalism from feudalism or mercantilism, both of which had private property and markets. What was historically revolutionary about capitalism was the extension of accumulation capacity beyond a privileged class—to the craftsman, the farmer, and eventually the wage worker.
Abraham Lincoln put this concisely in his 1859 address to the Wisconsin State Agricultural Society.1 The “prudent, penniless beginner,” he observed, “labors for wages awhile, saves a surplus with which to buy tools or land for himself; then labors on his own account another while, and at length hires another new beginner to help him.” This is not a description of the very wealthy. It is a description of the institutional pathway that capitalism is supposed to open to ordinary people.
One important operational measure of whether that pathway is open is the Average Propensity to Save (APS): the fraction of income that households save rather than consume. If capitalism is working, APS should be positive—or at least not deeply negative—across the income distribution. Structural dissaving means that a household is spending more than it earns, year after year, sustained by borrowing, asset liquidation, or transfer from others. It is the arithmetic negation of the Lincoln pathway.
APS is a flow measure: it records the fraction of current-period income not consumed. It is therefore a proxy for one specific form of accumulation capacity—income-financed surplus—not for total wealth formation. The channels it does not capture directly include capital gains on housing and equities (which can raise wealth without any positive saving flow), human capital investment (education, skills development), direct equity acquisition through employer stock programs, inherited wealth transfers, and pension wealth accrual—though APS is itself influenced by levels of wealth, since households carrying less debt and more assets face lower prior claims on income. What APS isolates is the Lincoln pathway specifically: whether households can accumulate from earned income, independent of prior asset holdings or asset-price appreciation. Each of these other channels deserves scrutiny in its own right, and a complete account of whether capitalism is delivering on its promise would examine all of them. The most plausible alternative accumulation channel for Q2–Q3 is housing appreciation, which in the US generated large nominal gains for homeowners in 2019–2022 and is real. But it is unavailable to the 35–45% of Q2–Q3 households who rent; it is illiquid and non-deployable in the way tools or equity capital are; and the long-run wealth-share data show the middle quintiles losing ground across the full 1989–2022 period despite intermittent asset-price windfalls. This essay uses APS as one useful lens—not the only one—because it is consistently measured across countries and over time in existing distributional national accounts, and because the pattern it reveals is clear enough to sustain the argument without requiring a composite index.
This essay uses the OECD Experimental Statistics on Household Distributional Accounts (EG DNA) for nine countries and the BEA/BLS Distribution of Personal Saving (NIPA Table 2.9) for the United States to measure APS by income quintile. Both datasets anchor distributional estimates to national accounts aggregates, ensuring cross-country comparability. The US data uses Disposable Personal Income (DPI) as the denominator, which excludes Social Transfers in Kind and is most comparable to the OECD cash-basis measure.
The United States Picture
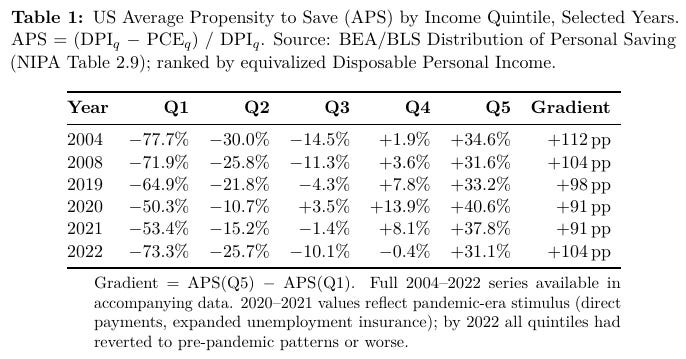
Table 1 shows US average propensity to save by income quintile for selected years from 2004 to 2022.2
Three features of Table 1 require comment.
The structural persistence of Q2 and Q3 dissaving. Q1 dissaving has a partial lifecycle explanation. The bottom quintile contains disproportionate numbers of young households borrowing to invest in human capital—education, skills, initial homeownership—and older households drawing down retirement savings. Both behaviors are consistent with rational lifecycle planning in a well-functioning economy. Figure 1, which shows average APS by age of household reference person for the United States (2024, BLS Consumer Expenditure Survey), confirms that the lifecycle hump is real: mean APS rises from +2.5% for households under 25, peaks at +30.1% for the 55–64 bracket, then declines as households enter retirement.
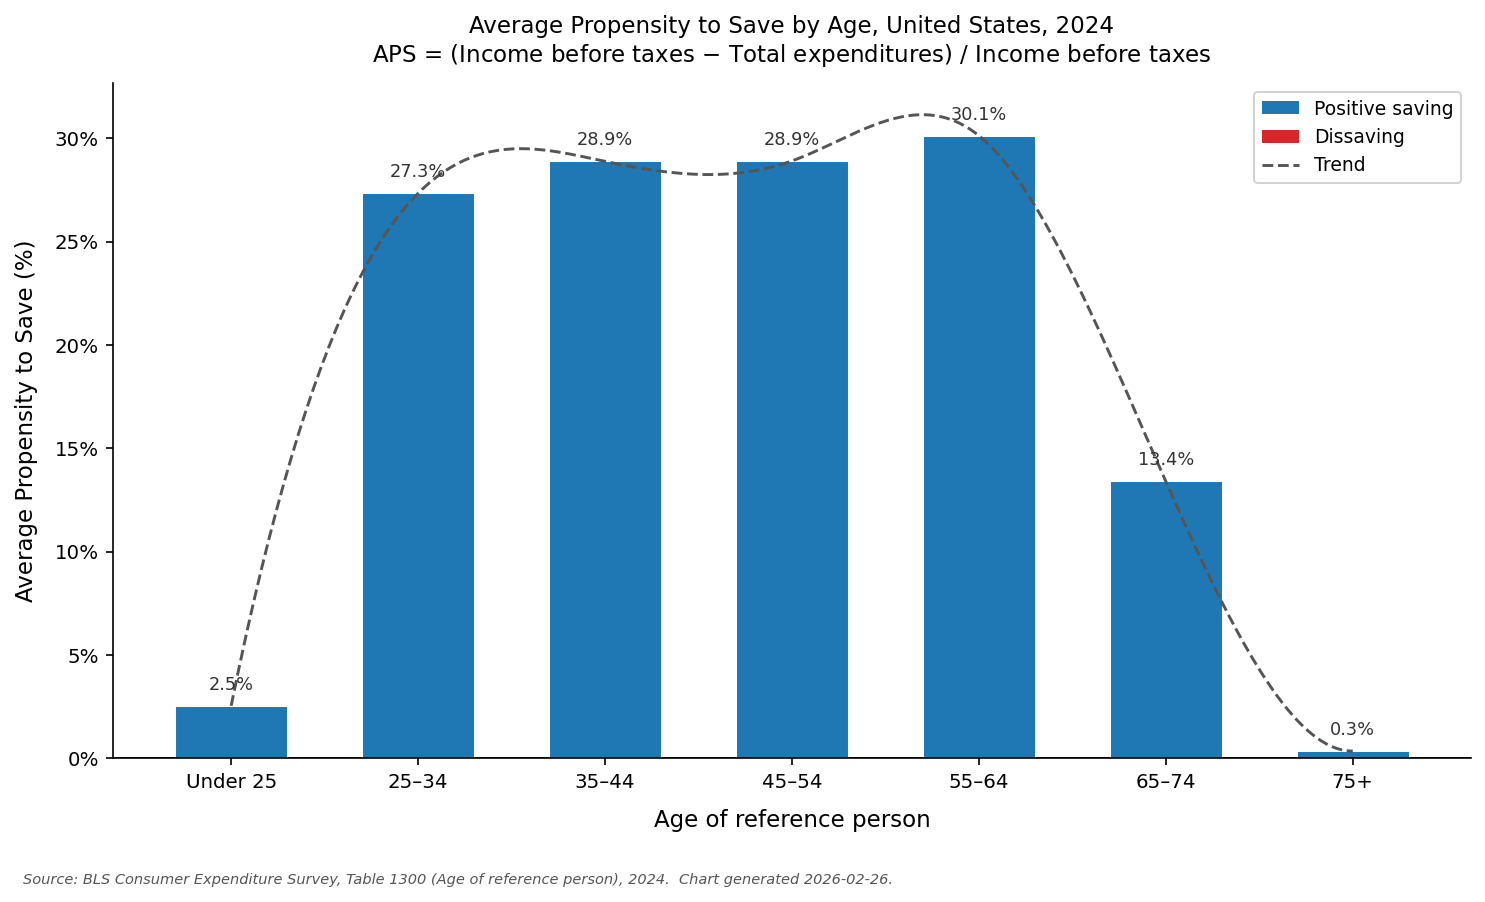
The lifecycle profile, however, does not explain away the quintile pattern, for two reasons. First, the CEX chart reports means across the full income distribution within each age bracket: the average 25–34 household earns approximately $100,000 and saves 27%. The Q1 household within that same age bracket earns a fraction of that—and dissaves. Age-bracket means conceal exactly the income-rank variation that the quintile data expose. Second, the lifecycle argument cannot account for Q2 and Q3 dissaving. Both quintiles consist predominantly of prime working-age households—the same demographic the CEX lifecycle profile shows saving at 25–30%. If the age composition of Q1 were the primary driver of its dissaving, Q2 and Q3 should be comfortably positive. They are not. A system in which the median household cannot save is not fulfilling the promise of capitalism, regardless of what it calls itself.
The gradient is large and stable. The difference between Q1 and Q5 ranges from +91 to +112 percentage points across the full series. This is not driven by exceptional Q5 saving: at 31–41%, Q5 saving is high but not extraordinary by international standards. The gradient is wide because of the depth of Q1–Q3 dissaving. And it is stable: two recessions, a financial crisis, a decade of low interest rates, and a global pandemic have each modestly compressed the gradient temporarily, then allowed it to snap back.
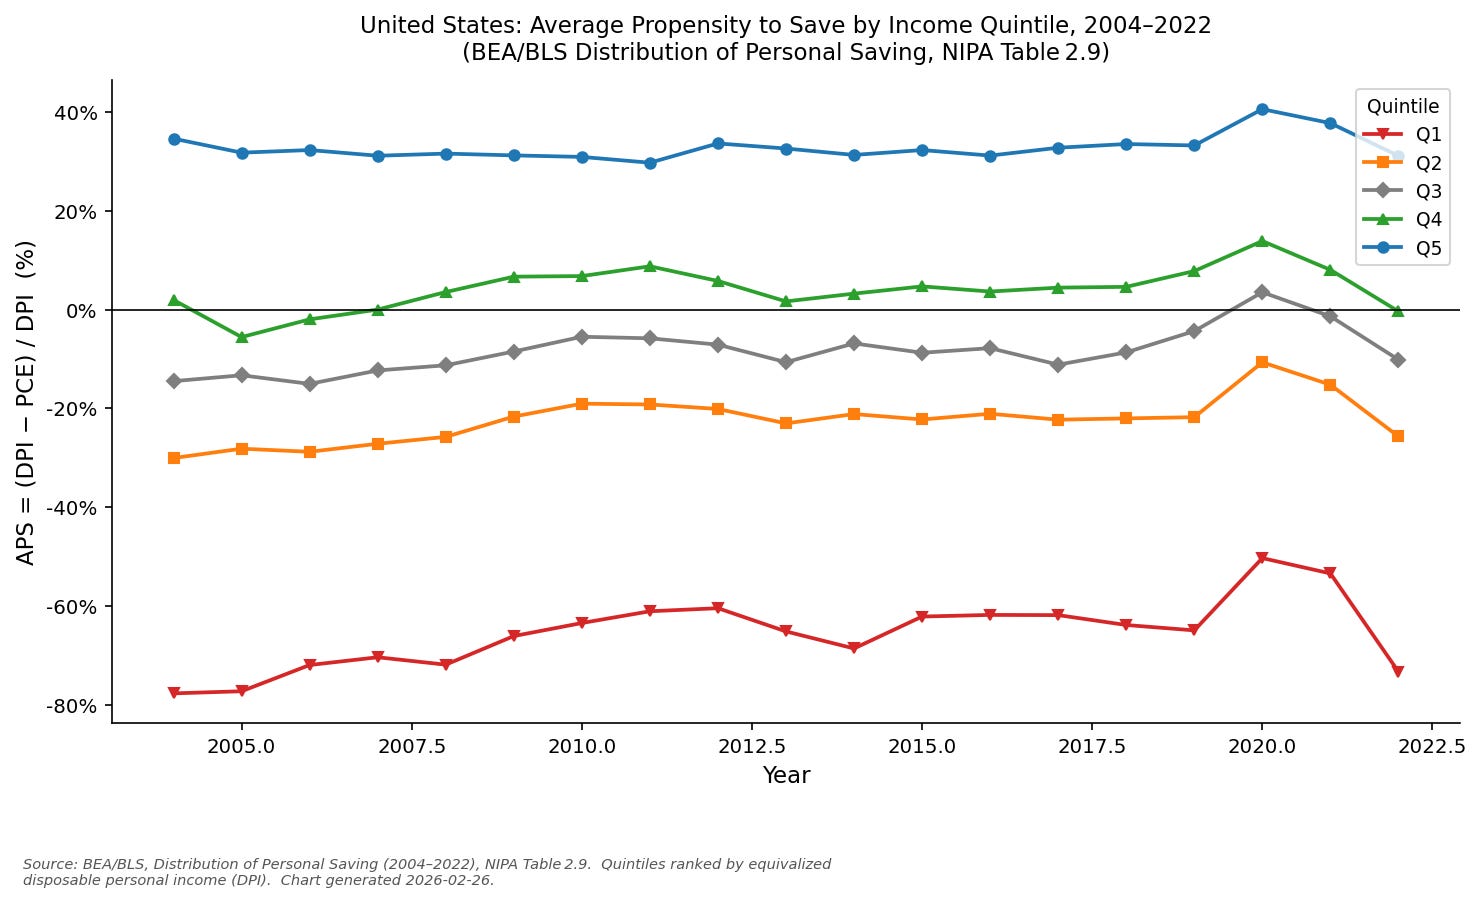
The pandemic as a natural experiment. The 2020–2021 stimulus episode is instructive. Two simultaneous forces raised Q1–Q3 saving rates substantially: federal transfers—direct payments, expanded unemployment insurance, student loan forbearance—and the lockdown-induced collapse of spending on restaurants, entertainment, and travel, which suppressed consumption even when households would otherwise have spent. Q3 briefly turned positive in 2020. Even Q1, however, never crossed zero: even at the peak of the largest peacetime transfer program in US history, the bottom quintile spent more than it earned. By 2022, with stimulus expired and inflation eroding real income, the gradient had widened to +104 pp and Q4 had joined Q1–Q3 in negative territory. The structure that stimulus momentarily concealed reasserted itself faster than it had been suppressed. Figure 2 traces the full temporal picture.
What sustains Q1–Q3 consumption above income? Three channels: consumer credit (credit cards, auto loans, payday lending), asset liquidation (drawing down savings, cashing out home equity), and inter-household transfers (remittances, family support) that are invisible to the national accounts. None of these is an accumulation mechanism. All three are instruments of decumulation—ways of consuming capital rather than forming it. Lincoln’s prudent penniless beginner, for three-fifths of American households, is not saving toward tools. He is borrowing against the future to cover the present.
Ten Countries: Where the US Sits
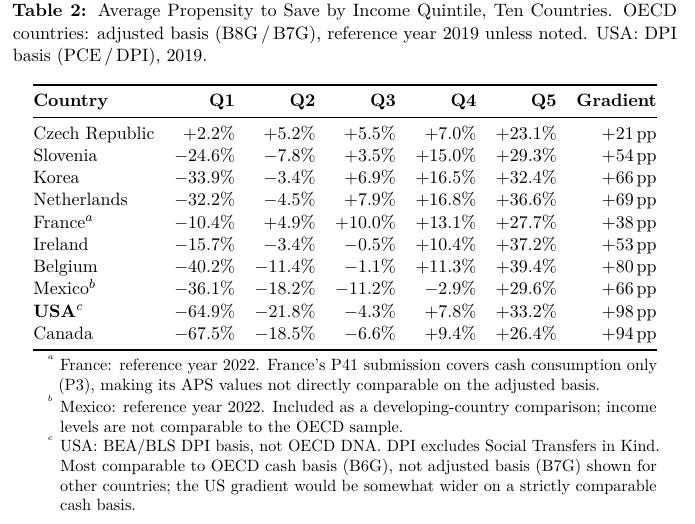
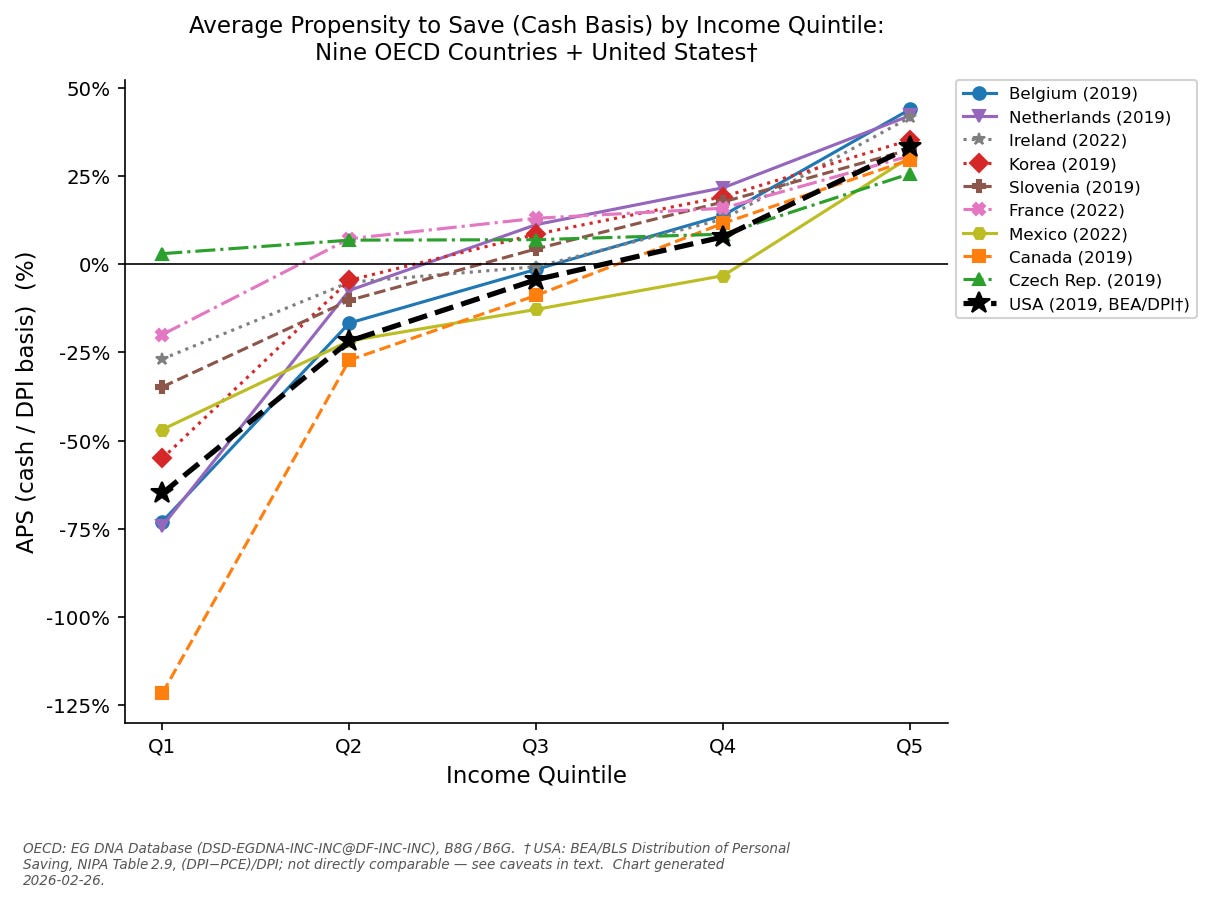
The OECD data cover nine countries across Europe and East Asia; together with the US, the full comparison spans ten countries at varied levels of income, welfare-state design, and economic history. The US is not unique in showing a positive APS gradient—all ten countries do. The rich save more than the poor everywhere and always. What varies is the magnitude of the gradient and where the quintile profiles cross zero. Table 2 shows the pattern.3
Several features of Table 2 merit attention.
The variation is not explained by national income level. Mexico, the poorest country in the sample, has a gradient of +66 pp and four dissaving quintiles. Czech Republic, a high-income European economy, has a gradient of +21 pp and zero dissaving quintiles. Belgium and Canada, both wealthy welfare states, show gradients above +80 pp. Income level predicts neither the gradient width nor the number of dissaving quintiles.
Welfare state generosity does not close the gap. Belgium and the Netherlands both have large, well-funded welfare states with substantial in-kind transfers (public healthcare, housing subsidies, education). Both still show Q1 dissaving of −32% to −40% and gradients of +69 pp to +80 pp. Income redistribution—the transfer of cash and services from higher to lower quintiles—compresses income inequality but does not eliminate structural dissaving at Q1–Q2. The reason is that redistribution operates on income flows, while dissaving is driven by the balance sheet: the stock of assets and debts that households carry into each period. A household with a mortgage absorbing 40% of gross income will dissave even if its cash income is supplemented by transfers, because the debt service is prior to any saving decision.
The US gradient leads the sample. At +98 pp, the US gradient is the widest in the sample on the basis shown, with Canada close behind (+94 pp on the adjusted basis; wider still on a comparable cash basis), and both substantially larger than Belgium (+80 pp), Korea (+66 pp), or Slovenia (+54 pp). The US is at the worst end of a group that already includes countries with deep Q1 dissaving.
Figure 3 shows the full ten-country comparison.
The Czech Republic Counterexample
Czech Republic deserves extended attention because it is not a minor outlier. It is a clean falsification of the claim that structural Q1–Q3 dissaving is an unavoidable feature of advanced market economies.
Czech Q1 saves +2.2% of adjusted income (or +3.0% on the cash basis). Czech Q2 saves +5.2%. Czech Q3 saves +5.5%. The gradient is +21 pp. These are not approximations of zero; they are definitively positive at every quintile in a country with GDP per capita comparable to Portugal and well above Mexico. The Czech Republic’s Gini coefficient (0.242) is the lowest in the ten-country sample, nearly 60 points below Mexico and well below the US and Canada.
Candidate explanations. No single structural factor fully accounts for Czech Republic’s breadth of saving. The available data support two as strong candidates; others are plausible on theoretical grounds and warrant further investigation, but cannot be established from national accounts data alone.
Debt-free homeownership. Between 1989 and 1992, the Czechoslovak and then Czech state privatized the bulk of the state-owned housing stock at nominal prices to sitting residents. This was not a market outcome; it was a political distribution. The effect was to eliminate from Czech Q1–Q3 households the single largest driver of dissaving in the US, Canada, and Belgium: mortgage debt service or rent paid to landlords in higher quintiles. In the US, a bottom-quintile household that rents from a top-quintile landlord transfers economic surplus upward with every monthly payment, before any saving decision is possible. Czech Q1–Q3 households, owning their homes outright, faced no such prior claim on their income.
The legal structure of the privatisation mattered as much as the fact of it. The Czech state conveyed direct, individually registered title to the sitting resident—not a tradeable financial instrument. That structural choice made rapid reconcentration structurally difficult: a housing title requires the full apparatus of property law to transfer, including formal registration, notarized transaction, and a functioning title-registry system. The contrast with the Russian voucher privatisations of industrial enterprises is instructive. Each Russian citizen received a tradeable voucher worth 10,000 roubles; most sold for cash within months to well-connected buyers who aggregated controlling stakes before any institutional infrastructure to prevent reconcentration had formed. Czech housing titles could not be similarly swept up because the transferability mechanism required precisely the Rule of Law infrastructure— title registries, property courts, transaction recording—that the state was simultaneously building. The distribution and the institution reinforced each other; neither was sufficient alone.
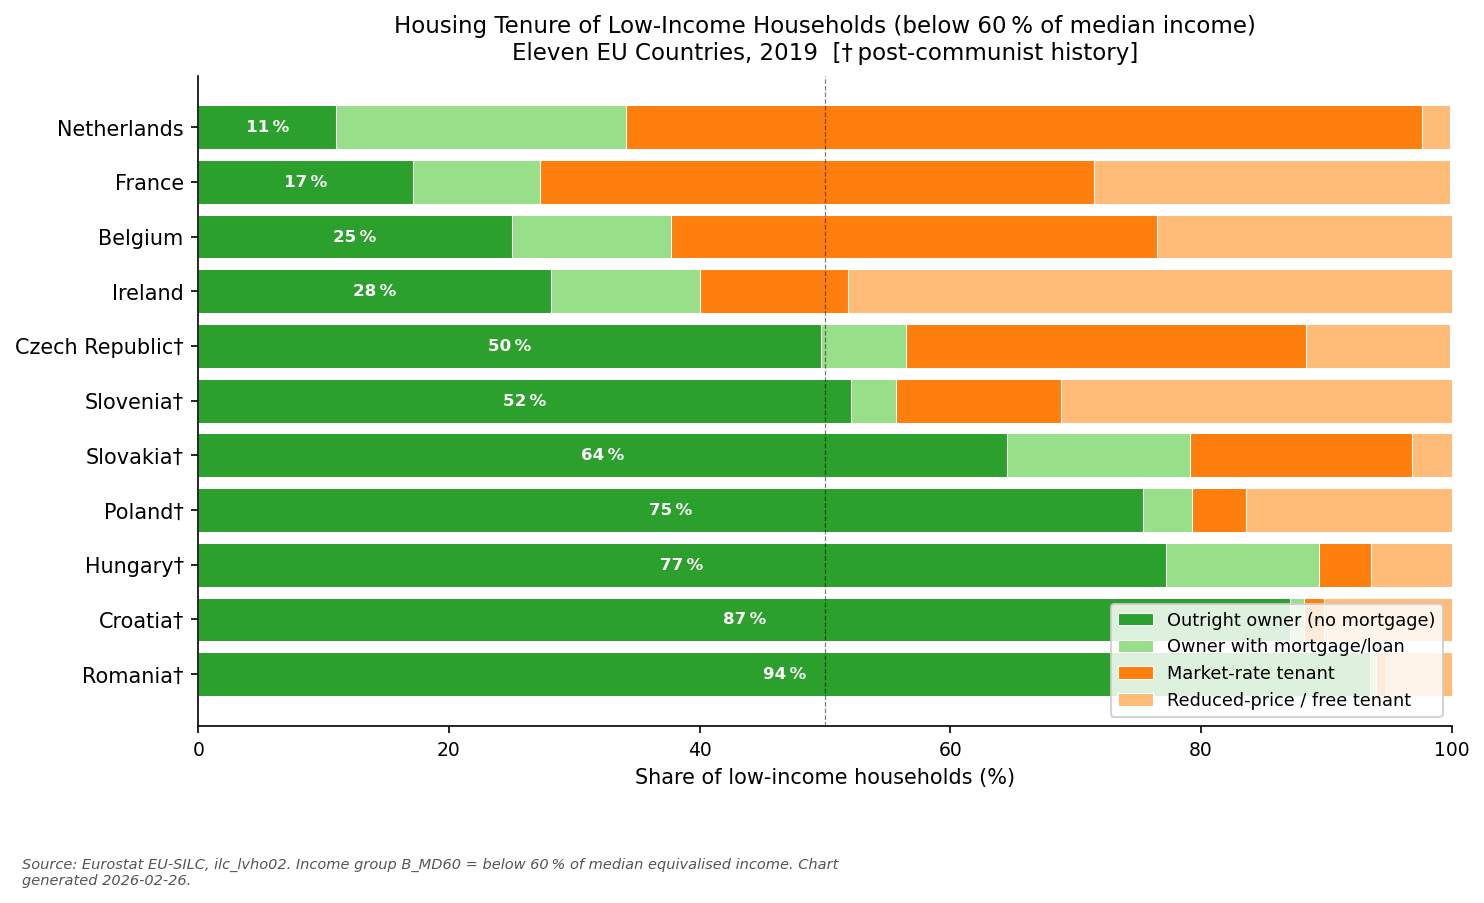
Figure 4 quantifies the tenure difference. Among households below 60% of median income in 2019, 49.7% of Czech households own their homes outright (no mortgage), compared with 25.0% in Belgium, 28.1% in Ireland, 17.1% in France, and 11.0% in the Netherlands. The contrast with the broader post-communist cluster is equally striking: Romania (93.5%), Croatia (87.1%), Hungary (77.2%), and Poland (75.4%) all show even higher outright ownership among low-income households, confirming that the Czech result is part of a systematic regional pattern.
The tenure data also provide an important caution against monocausal explanation. Slovenia—also a post-communist country with a similar history of housing privatisation—has a low-income outright ownership rate of 52.1%, marginally higher than Czech Republic’s 49.7%, yet its Q1 APS was −24.6% in 2019. Outright homeownership appears to be a necessary condition for broad saving but not a sufficient one. Something else differentiates the Czech outcome from the Slovenian outcome, and whatever that something is, it matters as much as the tenure structure.
Slovakia would be a sharper test still. Czech Republic and Slovakia were a single country until 1993 and underwent identical housing privatisation programs in 1989–92; the Eurostat data confirm Slovakia’s low-income outright ownership rate of 64.5%, higher than Czech Republic’s 49.7%. The Velvet Divorce itself was driven primarily by differences in industrial base and labour market quality—precisely the wage-compression channel this essay identifies as the second candidate explanation. If Slovak distributional APS data showed worse Q1–Q3 outcomes than Czech Republic’s despite its higher outright ownership rate, it would constitute a near-ideal natural experiment: identical housing conditions, divergent wage structures, cleanly separated by a known historical event. Slovakia is not currently in the OECD Distributional National Accounts sample; adding it would be the most informative single extension of this line of research.4
Compressed wages. The most plausible candidate for the additional factor is wage compression. Communist wage institutions produced a flat wage distribution that survived the post-1989 transition, and Czech Republic’s Gini coefficient (0.242) remains one of the lowest in the OECD sample. A household that owns its home outright can still dissave if income falls below the cost of food, utilities, healthcare, and transport. Czech Q1 wages as a fraction of mean wages are higher than in comparator countries, providing a margin above subsistence that is arithmetically unavailable to the US bottom quintile—and, apparently, to Slovenia’s as well.
Other candidates. Several additional factors may contribute, individually or in combination: Czech Republic’s unemployment rate was approximately 2% in 2019 (among the EU’s lowest), keeping Q1 income more wage-driven and less benefit-dependent than in higher-unemployment comparators; Czech Republic retains its own currency, allowing real wages and prices to adjust independently of the eurozone price floor to which Slovenia is bound; and historical differences in consumer debt levels at Q1–Q2 may create different residual prior claims on income. Disentangling these contributions requires microdata analysis beyond the scope of this essay.
The paradox stated explicitly. The country that best satisfies the operational test for capitalism got there through a process that was the opposite of market-driven: a communist-era redistribution of productive assets and a state-suppressed wage distribution. The US, which proclaims itself the capitalist exemplar, fails the same test.
This is not a paradox. It is a confirmation of the theory. Capitalism’s outcomes—broad or concentrated accumulation—depend on the initial distribution of productive assets and the degree to which rent extraction—returns from ownership and monopoly power rather than from productive contribution—has been suppressed. Czech Republic did not achieve broad accumulation through capitalism; it achieved it by starting from a distribution of assets that allowed market processes to function without creating the rent-income spiral that generates structural dissaving in Q1–Q3 elsewhere.
Standard rankings corroborate the equivalence. The Heritage Foundation’s Index of Economic Freedom—the most widely cited single-number measure of market capitalism—rates both countries in its Mostly Free tier, within a few index points of each other.5 The World Justice Project’s Rule of Law Index has ranked Czech Republic slightly above the United States in recent editions.6 The notable exception is Transparency International’s Corruption Perceptions Index, where the United States scores materially higher—a genuine institutional difference that warrants caution against treating the Czech case as a simple template.7
The connection to George and Piketty. This is not a novel observation. Henry George argued in Progress and Poverty8 (1879) that land rents—returns to an asset no one produced—capture the surplus generated by the whole community and concentrate it in the hands of whoever holds legal title, regardless of merit or effort. The mechanism he described applies precisely to what drives Q1 dissaving in the US: rent payments transfer income from tenants (disproportionately Q1–Q2) to landlords (disproportionately Q4–Q5) before any saving decision is made. The transfer is not a market failure; it is market success—for the asset owner.
Thomas Piketty’s central result9—when the return on capital (r) exceeds the growth rate (g), wealth concentrates geometrically over time—describes the dynamic that follows from an unequal initial distribution. If Q5 saves 33% of income while Q1 dissaves 65%, the asset gap compounds in every period. The APS gradient is not just a snapshot of inequality; it is a lower bound on the rate at which inequality is widening in the current period. Because capital gains accrue almost entirely to households already holding appreciable assets, the APS gradient likely understates the actual divergence in wealth-formation rates: Q4–Q5 benefits from both positive saving flows and asset appreciation, while Q1–Q3 has access to neither. Czech Republic, with its near-flat saving profile, is running a different dynamic: one in which accumulation is broadly distributed, and the Piketty spiral is not yet strongly in play.
A necessary hedge. The Czech Republic is one observation, and many other post-communist countries received similarly “clean” initial asset distributions in 1989–91 and ended up with extreme oligarchy: Russia, Ukraine, Romania. The initial distribution was necessary but not sufficient. Russia’s experience illustrates the failure mode precisely: Russian industrial privatisation used tradeable vouchers rather than registered individual titles. Without an institutional infrastructure of transparent title, functioning property courts, and enforceable transfer records—without, that is, the Rule of Law acting as settlor of accounts—the distributed assets were reconcentrated within years. What Czech Republic also had—and Russia lacked—was that institutional follow-through: a functioning rule of law, relatively low levels of post-transition corruption, and the disciplining pressure of EU accession requirements. The lesson is therefore not “redistribute assets and capitalism will follow.” The lesson is that the initial distribution of assets and the institutional capacity to prevent their subsequent reconcentration through rent and coercion both matter. The first condition Czech Republic got from its communist history; the second it built through its European integration.
The saving record of the other post-communist countries reinforces this point from the opposite direction. Romania (93.5% low-income outright ownership), Croatia (87.1%), and Hungary (77.2%) preserved distributed housing just as Czech Republic did—and yet preliminary estimates from Eurostat Household Budget Survey data suggest their Q1 dissaving is at least as deep as in Belgium or the Netherlands. High outright ownership evidently cannot prevent dissaving at the subsistence margin when absolute income levels are too low and institutional quality is insufficient. The Czech outcome required all three conditions simultaneously: distributed housing, adequate wage floors, and the rule-of-law environment that prevented reconcentration. The first two were communist legacies; the third was built through EU accession.
Diagnosis: What the US Has Instead of Capitalism
The US data do not show capitalism failing to deliver on its promise. They show a system in which market mechanisms coexist with structural features that suppress broad accumulation—features that are not capitalist in the sense defined above but that have been given capitalism’s name by the people who benefit from them.
Four mechanisms are responsible for most of the structural dissaving in Q1–Q3.
Before enumerating them, it is necessary to address the most common objection to structural explanations of this pattern: that Q1–Q3 dissaving reflects cultural preference—consumerism, poor financial discipline, present-biased discount rates—rather than institutional constraint. The objection rests on a category error. A household paying 40% of gross income in rent is not making a consumption choice; it is servicing someone else’s asset, meeting a prior claim on income that was established before any saving decision became possible. Mortgage debt service, consumer credit interest, and non-negotiable healthcare premiums operate the same way. Prior claims are compulsory transfers to asset owners, enforced by the legal system. The relevant distinction is between expenditure that can be reduced by preference (discretionary consumption) and payments that cannot be avoided without forfeiting access to housing, transportation, or healthcare (prior claims). All four mechanisms below operate through prior claims—through the structure of asset ownership and debt, not through the preferences of lower-income households.
Asset concentration and rent flows. When Q4–Q5 owns most of the housing stock, stock market wealth, and business equity, the income from those assets bubbles up to the top quintiles regardless of labor market outcomes. More importantly, the corresponding costs—rent, interest, fees—flow out of lower quintiles as prior claims on income. A household paying 40% of gross income in rent is not making a consumption choice; it is servicing an asset that its counterpart in Czech Republic owns outright. The rent payment is a transfer of economic surplus from Q1–Q2 to Q4–Q5 that occurs upstream of any saving decision.
Income composition at the top. The data show that APS rises sharply with income. The behavioral explanation is that high-income households simply prefer to save more. The structural explanation is different: as income rises through the quintile distribution, it becomes increasingly composed of returns to asset ownership—dividends, capital gains, rent, royalties—rather than returns to labor. These are returns to things, not people. They reflect legal entitlements enforced by the state, not productive contribution. At the extreme top of the income distribution, the bulk of income is economic rent in the technical sense: returns that exceed what would be required to elicit the underlying activity. This income is not capitalism producing its reward for contribution; it is the state enforcing property claims that allow surplus extraction without productive contribution.
Market power and wage suppression. Competitive labor markets in a genuinely capitalist economy would drive wages toward the marginal product of labor. The US labor market, in significant sectors, does not function this way. Monopsony power in labor markets (the buyer’s equivalent of monopoly: a market dominated by a single or small number of employers)—documented by Azar, Marinescu, and Steinbaum, among others10—allows employers to pay wages below competitive levels, suppressing Q1–Q3 income and therefore their saving capacity. This is not a market outcome; it is a failure of market competition, enabled by regulatory tolerance and the erosion of countervailing institutions (unions, labor standards enforcement).
Consumer credit as surplus extraction. Credit is not inherently non-capitalist. But when Q1–Q3 households sustain above-income consumption through consumer credit at high interest rates, the interest payments constitute a systematic transfer of economic surplus from lower to upper quintiles. The credit market functions as a mechanism for extracting the future income of Q1–Q3 households on behalf of the financial sector—which is disproportionately owned by Q4–Q5. The household is not accumulating capital; it is consuming it in advance, at a price.
These four mechanisms are not features of capitalism. They are features of the systems capitalism should have replaced: feudal rent, aristocratic monopoly, debt peonage. To call a system that runs on these mechanisms “capitalist” is to mistake the label for the substance.
The Policy Implication: Restorative Justice and the Silent Partner
If one sees value in pursuing the promise of capitalism, the appropriate policy response follows from the diagnosis. If non-capitalist rent-extraction mechanisms have suppressed broad accumulation, the remedy is to dismantle those mechanisms—not to impose a preferred distributional pattern on top of them.
The moral foundation: Nozick and Carnegie. Robert Nozick argued,11 correctly, that redistribution to achieve patterned outcomes is morally problematic: it treats the holdings of individuals as resources to be reassigned by the state in pursuit of a social ideal—treating persons as instruments of a collective goal rather than as ends in themselves. The question the APS data forces, however, is whether the concentrated holdings in question were legitimately acquired in the first place.
Andrew Carnegie—not ordinarily cited in debates about economic justice—supplied the missing term. In The Gospel of Wealth12 (1889), he argued that “wherever great wealth accrues honorably, the people are always silent partners”: the public infrastructure, the stable legal order, the network of workers and customers, and above all the location value created by the simple presence of others all contribute to the returns that accrue to the named owner. The silent partner’s contribution is real; it was never compensated; and it creates a prior equity claim that exists independent of any question about redistribution.
Nozick’s legitimacy condition and Carnegie’s silent partner converge on the same conclusion. Restorative justice is not the state taking from wealth-holders; it is the state returning to the silent partner what the silent partner produced and was never paid. The distinction from redistribution is not semantic. Redistribution is motivated by a desired outcome and has no principled stopping point. Restorative justice is motivated by a prior uncompensated contribution and stops when that contribution has been returned. The state does not impose a pattern; it corrects extractions it was complicit in enabling.
The Rule of Law as fiduciary enforcement. This framing gives the Rule of Law a specific meaning in context. The legal order is not merely a precondition that capitalism requires from outside; it is the mechanism by which the community, acting as equity holder, enforces its own prior claim against those who would appropriate the silent partner’s share. When the state permits oligarchic reconcentration—through rent extraction, regulatory capture, or market power—it is not merely failing a policy objective; it is breaching a fiduciary duty to the beneficiary whose contribution it was charged to protect. The WJP Rule of Law rankings noted above can be read as measuring precisely that fidelity.13
Three areas of reform follow from this logic.
1. Asset claims: securing the partner’s equity. The primary driver of Q1–Q3 dissaving is the prior claim that rent and debt service make on income before any saving is possible. When institutional investors acquire residential housing as a financial asset, they are not producing a new good; they are extracting the location value that the surrounding community created. That is the silent partner’s equity, not the investor’s. Policy that limits institutional ownership of single-family housing, strengthens pathways to homeownership, and reforms bankruptcy and debt-collection law does not penalize production; it removes the toll booth between the worker and the Lincoln pathway. The Czech lesson is that the balance sheet is the operative variable: income transfers that leave the asset distribution unchanged do not close the saving gap, as Belgium and the Netherlands demonstrate.
2. Labor market competition: ending monopsony as restitution. Competitive labor markets drive wages toward the marginal product of labor. When monopsony power allows employers to pay wages below competitive levels, the gap between the competitive wage and the actual wage is not the employer’s legitimate return; it is an excess appropriation extracted from the silent partner’s share. Employers are entitled to appropriate the surplus their capital and organization generate—that is why employment exists. The objection is not to appropriation as such but to the excess that market power makes possible at the silent partner’s expense. Antitrust enforcement against monopsony, minimum wage floors set at competitive levels, and the right to collective bargaining are not concessions to anti-market ideology. They restore the boundary between the employer’s legitimate return and the excess that competitive markets would not have permitted.
3. Rent capture: the cleanest accounting. Henry George’s proposal—heavily taxing economic rent while reducing taxes on labor and productive capital—is an appropriate instrument for honoring Carnegie’s standard. Returns to location, natural resources, network effects, intellectual property monopolies, and financial leverage are, by definition, returns that the recipient’s productive contribution did not create. They are the silent partner’s surplus. Taxing economic rent does not penalize production; it recaptures for the community the value that the community created but that the legal system currently assigns to named title-holders.
These reforms are difficult. Regulatory institutions can be captured by the interests they regulate; that is Buchanan’s insight and it is correct. Marxists argue that the mechanisms of exploitation are inherent to capitalism and cannot be reformed away; that argument too has empirical support in the persistence of the US gradient across administrations and reform cycles. But neither objection is an argument for despair. Both name the challenge of building institutions strong enough, and sufficiently resistant to capture, to deliver on capitalism’s promise. Czech Republic built those institutions—imperfectly, partially, with European help. The fact that it is difficult is not a reason to stop trying. It is a description of the work that needs doing.
Restorative justice as ongoing commitment. The Czech case makes one lesson especially clear: restorative justice is not a one-time event. The 1989 housing privatisation was not a permanent solution; it was a starting condition that still required active institutional maintenance. What distinguishes Czech Republic from the post-communist countries that received the same initial asset distribution and then lost it to oligarchy is not what happened in 1989—it is what the state continued to do afterward. Capitalism’s promise, once created, does not sustain itself. The rents that concentrated ownership generates compound continuously, and without a state acting as perpetual settlor of accounts—continuously ensuring that market processes do not reconvert Lincoln’s road into a toll bridge—each generation inherits a narrower pathway than the last. This is not an argument against markets. It is an argument for the institutional vigilance that keeping capitalism capitalist requires.
Conclusion: The Measurement Is the Argument
The definition of capitalism offered here is explicitly normative. It establishes a standard—generalized capacity for accumulation—and asks which countries are meeting it. The fact that no system fully achieves the standard is expected; normative definitions are measuring instruments, not descriptions of current reality. We define a healthy diet normatively and then ask how far short of it Americans fall. The definition is not circular because the gap it measures is real and consequential.
What the APS data show is that the United States is far short of being a leading example of real capitalism.
For 2004–2022, the bottom 40–60% of American households have been structurally prevented from saving. The pandemic stimulus of 2020–2021 temporarily closed the gap, then the gap snapped back—and widened.
The mechanisms responsible are not failures of capitalism; they are the operation of non-capitalist elements—rent extraction, monopsony, asset concentration, consumer credit at extractive rates—that have been allowed to dominate the distribution of accumulation opportunities while claiming capitalism’s name.
The Czech Republic, whose egalitarian asset distribution traces to a communist-era housing privatization and compressed wage institutions, passes the test the United States fails. This is not a recommendation to import Czech institutions. It is a demonstration that the capitalist ideal of generalized accumulation is empirically achievable, and that the path to it runs through the initial distribution of productive assets and the suppression of rent—not through the label attached to the system.
The political implication is uncomfortable for both sides of the conventional debate. Those who call themselves capitalism’s defenders are often defending the rent-extraction mechanisms that suppress broad accumulation. Those who call themselves capitalism’s critics are often attacking a system that does not deserve the name they are attacking. Both groups are, in different ways, complicit in maintaining a system that delivers concentrated accumulation while calling it something else.
Stop defending the label. Start measuring the substance.
For the United States: it is time to do a better job of being capitalist.
Notes
1 Lincoln, A. (1859). “Address to the Wisconsin State Agricultural Society.” Milwaukee, Wisconsin, September 30, 1859.
2 US data are from the BEA/BLS joint Distribution of Personal Saving (NIPA Table 2.9 distributional estimates), 2004–2022, published July 2024. APS is computed as (DPIq−PCEq)/DPIq, where DPI and PCE quintile shares are drawn from the BEA decile-level release and summed to quintiles. Methodology: Gindelsky (2025), Review of Income and Wealth; BEA (2024), The Methodology for Distributing Personal Saving via a Blended Survey–National Accounts Approach. Because DPI excludes Social Transfers in Kind (D63), the closest OECD comparator is the cash basis (B6G), not the adjusted basis (B7G) shown in Table 2; the US gradient would be somewhat wider on a strictly comparable basis. BEA distributed totals do not exactly match NIPA aggregates because some flows cannot be attributed to quintile households; quintile-level APS is internally consistent within the distributed framework. CEX under-reporting may modestly overstate Q5 APS relative to OECD DNA methods.
3 OECD data for nine countries are drawn from the OECD Experimental Statistics on Household Distributional Accounts (dataflow DSD_EGDNA_INC_INC), accessed via the OECD SDMX REST API. The APS shown is the adjusted basis: APSadj=B8G/B7G, where B8G is gross saving and B7G is gross adjusted disposable income including Social Transfers in Kind (D63). Reference years: 2019 for Belgium, Canada, Czech Republic, Korea, Netherlands, and Slovenia; 2022 for France, Ireland, and Mexico. Cross-country comparability caveats: (1) The US DPI concept excludes D63; the closest OECD comparator is the cash basis (B6G), so the US gradient shown is somewhat narrower than a fully comparable figure would be. (2) France’s P41 submission covers cash consumption only (P3), making its adjusted-basis APS not directly comparable to other countries. (3) Quintile equivalisation scales differ across datasets. Despite these caveats, qualitative conclusions are robust: the US gradient of +98 pp would be wider, not narrower, on a fully comparable cash basis; Czech Republic’s positive saving at every quintile is confirmed on both adjusted and cash bases.
4 The Czech–Slovak comparison satisfies the two main requirements for a natural experiment: a common shock (identical housing privatisation in 1989–92, confirmed by the Eurostat tenure data showing comparable low-income outright ownership rates) and a plausibly exogenous divergence (the Velvet Divorce separated two economies with different industrial structures and wage institutions, for reasons—constitutional disagreement, pace of liberalisation—largely unrelated to housing policy). The counterfactual prediction is crisp: if wage compression drives the Czech breadth of saving, Slovakia should show worse Q1–Q3 APS than Czech Republic despite its higher outright homeownership rate (64.5% vs. 49.7%). Slovak quintile-level distributional saving data do not appear to be in the public OECD DNA release. A preliminary estimate combining the Eurostat Household Budget Survey (HBS, 2015) for consumption expenditure with EU-SILC income distributions—two separate surveys joined under strong methodological caveats—places Slovak Q1 APS at approximately −67%, comparable to Belgium (−62%) and the Netherlands (−64%) on the same rough measure. Czech Republic Q1 on the same measure is approximately −7%: still the lowest dissaving rate in the fifteen-country sample, and dramatically better than Slovakia despite Slovakia’s higher outright homeownership rate. The directional prediction of the natural experiment is therefore confirmed in the available data: identical housing privatisation, sharply divergent saving outcomes. Constructing rigorous estimates—via OECD DNA accession for Slovakia or a consistent consumption imputation from EU-SILC microdata—remains the most informative single extension of this line of research.
5 Heritage Foundation, Index of Economic Freedom, published annually.
6 World Justice Project, WJP Rule of Law Index, published annually.
7 Transparency International, Corruption Perceptions Index, published annually.
8 George, H. (1879). Progress and Poverty. D. Appleton & Co.
9 Piketty, T. (2014). Capital in the Twenty-First Century. Harvard University Press.
10 Azar, J., Marinescu, I., & Steinbaum, M. (2022). “Labor Market Concentration.” Journal of Human Resources, 57(S), S167–S199.
11 Nozick, R. (1974). Anarchy, State, and Utopia. Basic Books.
12 Carnegie, A. “The Gospel of Wealth, Part II.” North American Review, 183(604):1096–1106 (Dec. 7, 1906). Originally published as “Wealth,” North American Review, 148(391):653–664 (1889). JSTOR 25105713.
13 The connection between Rule of Law and the silent partner’s equity will be developed more fully in a companion essay, “Carnegie’s Silent Partners.”

There are many many reasons that it would be much better if we in the US had a more progressive distribution of both income and wealth. However, capital formation is not one of them. In terms of generating the capital necessary to start new businesses or to expand existing businesses, it is probably true that a degree of concentration has some advantages. One advantage is that those with a large amount of wealth are likely to be more willing to risk large sums on risky deals because - up to a certain level - it will not really put them at risk. The other reason is that the cost of raising money from a small number of large investors is probably a lot lower than the cost of raising numerous small amounts from thousands of small investors. Thus, lumpy capital may create a better environment for new businesses to flourish. At some point, excessive concentration - e.g., the town or region in which one family has all the wealth, is bad because it can create a situation in which the idiosyncratic investment restrictions imposed by one or a small number of investors can exclude certain promising ventures from financing. But we are in no way at or near that level of concentration - we have a wide variety of very wealthy and, in some cases, eccentric potential investors.